Considering the fate of evaporated water across basin boundaries – Implications for water footprinting
A growing demand for water-intensive goods has led to rising attention on water footprinting. In this context, the water accounting and vulnerability evaluation model (WAVE+) was developed. WAVE+ considers on the accounting side the basin internal evaporation recycling ratio (BIER), which denotes the average fraction of evaporation re-precipitating in the originating basin. However, an enhanced fate-of-evaporation analysis across basin boundaries was so far not yet included. This research aimed at overcoming this lack. Based on a previously developed dataset on the fate of land evaporation, we implemented basin external evaporation recycling ratios (BEER) into water footprinting for the first time. The consideration of both the BIER (> 5 % in 2 % of the world’s basins) and the BEER (> 50 % in 37 % of the world’s basins) allowed us to use three types of water inventories (basin internal inventory, basin external inventory and inventory across all basin boundaries), which implied different consequences for volumetric and impact-oriented water footprinting. Regarding impact-oriented water footprinting, we derived characterization factors showing that water consumption in one basin can lead to positive supply effects in surrounding basins, which in 19 % of the world’s basins overweigh the negative impacts in the originating basins.
An overview on all derived factors (evaporation recycling ratios and characterization factors) is presented through the tables below. Average monthly and annual factors for basins, countries and world regions are provided through spreadsheets, which differentiate between systems under study referring to unspecified, agricultural and non-agricultural consumptive water uses. With regard to basins, additional kmz-files are available for download, which can be load into a google earth layer. The kmz-files focus on data referring to unspecified systems under study and plot within this context the annual averages of all derived factors.
For more information we refer to the following publication:
Link, Andreas, Ruud van der Ent, Markus Berger, Stephanie Eisner, and Matthias Finkbeiner. 2020. “The Fate of Land Evaporation – a Global Dataset.” Earth System Science Data 12 (3): 1897–1912. https://doi.org/10.5194/essd-12-1897-2020.
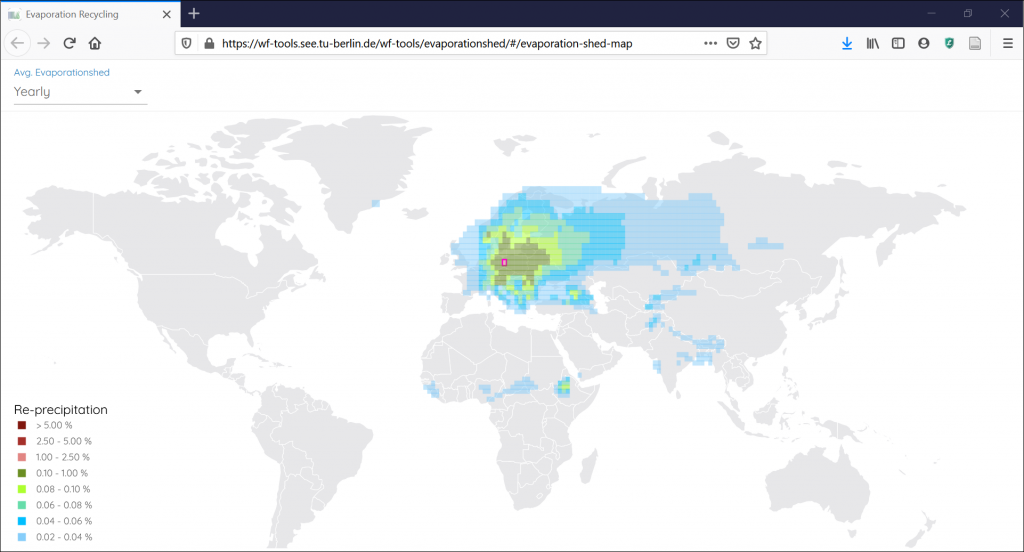
Online tool for spatial tracking of evaporation
Evaporation recycling ratios
| Basin internal evaporation recycling [0,1] (BIER): Average fraction of evaporation re-precipitating in the originating basin |
| Runoff-relevant basin internal evaporation recycling ratio [0,1] (BIERrunoff): Considers that only a part of the basin internal re-precipitation contributes to the building of new local blue water runoff |
| Basin external evaporation recycling [0,1] (BEER): Average fractions of evaporation re-precipitating in the sum of all outlying basins |
| Runoff-relevant basin external evaporation recycling ratio [0,1] (BEERrunoff): Considers that only a part of the basin external re-precipitation contributes to the building of new local blue water runoff |
| Terrestrial evaporation recycling ratio [0,1] (TER): Average fractions of evaporation re-precipitating over land (= in the sum of all drainage basins) |
| Runoff-relevant basin external evaporation recycling ratio [0,1] (TERrunoff): Considers that only a part of the terrestrial re-precipitation contributes to the building of new local blue water runoff |
Characterization factors
| Water deprivation index [0.001,1] (WDI) Express local freshwater scarcity while describing the potential to deprive other users when consuming water in this basin and month Considers both relative blue water scarcity based on a consumption-to-availability ratio (extended by indexes considering ground and surface water stocks) as well as absolute blue water shortages derived from the ratio of local potential evapotranspiration to precipitation A value of 1 denotes in this context the highest water deprivation potential, whereas a value of 0.001 refers to the lowest one |
Combined characterization factors
| WAVE+ Basin internal characterization factor combining the WDI with BIERrunoff WAVE+ = (1 – BIERrunoff)*WDI Multiplied with the basin and month specific evaporative water consumptions, WAVE+ factors can be used to determine the basin internal risk of freshwater deprivation |
| WAVEext Basin external characterization factor combining the WDI with BEERrunoff over all receptor basins (m) WAVEext = ∑(BEERrunoff,m * WDIm) Multiplied with the basin and month specific evaporative water consumptions, WAVEext factors can be used to determine the external freshwater replenishment potential (represent the beneficial supply effects to external receptor basins) |
| WAVEt_b Basin trans-boundary characterization factor balancing basin internal risks (WAVE+) with the beneficial effects in outlying basins (WAVEext) WAVEt_b = WAVE+ – WAVEext Multiplied with the basin and month specific evaporative water consumptions, WAVEext factors can be used to determine the trans-boundary risk of freshwater deprivation. This describes the potential net impact across all basin boundaries. It could potentially turn negative implying that the positive supply impacts towards external basins outweigh the negative impacts on the source basin itself |
Downloads
Results basin level – Spreadsheets
- BEER basins XLSX, 1 MB
- BEER runoff basins XLSX, 1 MB
- BIER basins XLSX, 1 MB
- BIER runoff basins XLSX, 1 MB
- TER basins XLSX, 2 MB
- TER runoff basins XLSX, 1 MB
- WAVE ext basins XLSX, 1 MB
- WAVE plus basins XLSX, 1 MB
- WAVE t b basins XLSX, 1 MB
- WDI basins XLSX, 1 MB
Results basin level – Google earth files
- BEER basins KMZ, 3 MB
- BEER runoff basins KMZ, 3 MB
- BIER basins KMZ, 3 MB
- BIER runoff basins KMZ, 3 MB
- TER basins KMZ, 3 MB
- TER runoff basins KMZ, 3 MB
- Wave ext basins KMZ, 3 MB
- Wave plus basins KMZ, 3 MB
- Wave t b basins KMZ, 3 MB
- WDI basins KMZ, 3 MB
Results country level – Spreadsheets
- BEER countries XLSX, 123 KB
- BEER runoff countries XLSX, 123 KB
- BIER countries XLSX, 126 KB
- BIER runoff countries XLSX, 123 KB
- TER countries XLSX, 125 KB
- TER runoff countries XLSX, 124 KB
- WAVE ext countries XLSX, 123 KB
- WAVE plus countries XLSX, 125 KB
- WAVE t b countries XLSX, 130 KB
- WDI countries XLSX, 120 KB
Results world region level – Spreadsheets
- BEER regions XLSX, 21 KB
- BEER runoff regions XLSX, 55 KB
- BIER regions XLSX, 24 KB
- BIER runoff regions XLSX, 24 KB
- TER regions XLSX, 24 KB
- TER runoff regions XLSX, 23 KB
- WAVE ext regions XLSX, 24 KB
- WAVE plus regions XLSX, 24 KB
- WAVE t b regions XLSX, 24 KB
- WDI regions XLSX, 24 KB